Blog
Insurance Lead ROI: A Step-by-Step Guide for 2026
Discover how to calculate insurance lead ROI to stop wasting budget. Track full acquisition costs, closing rates, and commissions for maximum agency profit.

What if the insurance lead source sending you the most prospects is quietly draining your budget? Lead volume and contact rates can look strong while actual returns tell a different story. To understand how to calculate insurance lead ROI, look beyond the price per lead and the number of sales.
The challenge is that acquisition costs can include agent time and follow-up, while commissions may arrive well after a lead comes in. Judge results too early, and a promising source may look unprofitable. Compare lead types without accounting for their different costs and sales cycles, and the numbers can mislead you.
This guide explains how to compare attributable revenue with the full costs of acquiring and working leads. You’ll learn which costs and outcomes to track, how to account for delayed sales, and how to compare sources and insurance verticals on consistent terms. Use your agency’s own data to identify practical improvements, without relying on generic benchmarks or unsupported performance promises.
Key Takeaways
- Learn how to calculate insurance lead ROI by comparing attributable revenue with total investment.
- Separate ROI from cost per lead and close rate to see whether acquisition is generating profitable business.
- Build a source comparison table that tracks lead age, verification, contact activity, conversions, and full costs.
- Use consistent follow-up processes and a suitable measurement window before judging real-time and aged lead cohorts.
- Connect CRM delivery, a built-in dialer, phone verification, and consent records to the inputs you can monitor in your workflow.
Why Insurance Lead ROI Matters More Than Cost Per Lead
Buying leads creates opportunities. Profit comes from turning some of those opportunities into attributable business at a return that justifies the full investment. That’s why cost per lead, or CPL, can’t answer the most important question: did this source generate a worthwhile financial return for your agency?
Insurance lead ROI is the net financial return attributable to a lead source, measured against the total investment required to acquire and work those leads. It connects activity to a business outcome. Lead count shows volume; ROI helps show whether that volume paid off.
What does insurance lead ROI measure?
ROI compares attributable financial return with investment. It differs from CPL, which measures acquisition cost per record, and from contact, appointment, and close rates, which measure stages of the sales process. Those metrics help explain performance, but none alone shows whether the revenue earned justified the expense. For a broader overview, see What is Return on Investment (ROI)?
Set your definitions before comparing results. Decide what counts as revenue, which expenses belong in the calculation, how a sale is credited to a lead source, and how long a cohort has to mature. Revenue attribution depends on your agency’s accounting method. For example, you might track commission received or use another consistent revenue measure. Apply the same method to every source in the comparison.
- Revenue: Define which policy outcomes and revenue amounts qualify.
- Expenses: Include applicable acquisition, follow-up, labor, and technology costs.
- Attribution: Set a consistent rule for connecting issued policies and revenue to leads.
- Measurement period: Allow enough time for the sales cycle to develop, then use the same window across cohorts.
Inconsistent inputs can make a source appear stronger or weaker for reasons unrelated to its actual performance. A short reporting window may miss sales that close later. A calculation that counts lead spend but ignores follow-up labor may overstate returns.
Why can low-cost leads still underperform?
A lower acquisition cost can be offset by weaker contact or conversion outcomes, or by more time and technology needed to work the leads. Lead price is one input, not proof of profitability. Compare total investment with attributable outcomes before drawing a conclusion.
Consider two hypothetical lead cohorts measured with the same revenue rules and reporting window. Cohort A costs less to acquire but produces fewer attributable policy sales. Cohort B costs more, but the revenue from its sales may be enough to offset the added expense. Neither cohort wins on lead price alone. Calculate each one’s net return using your own tracked costs and outcomes.
That’s the practical starting point for how to calculate insurance lead ROI: define the measurement rules first, then judge lead sources on financial return rather than volume or sticker price.
How to Calculate Insurance Lead ROI with a Clear Formula
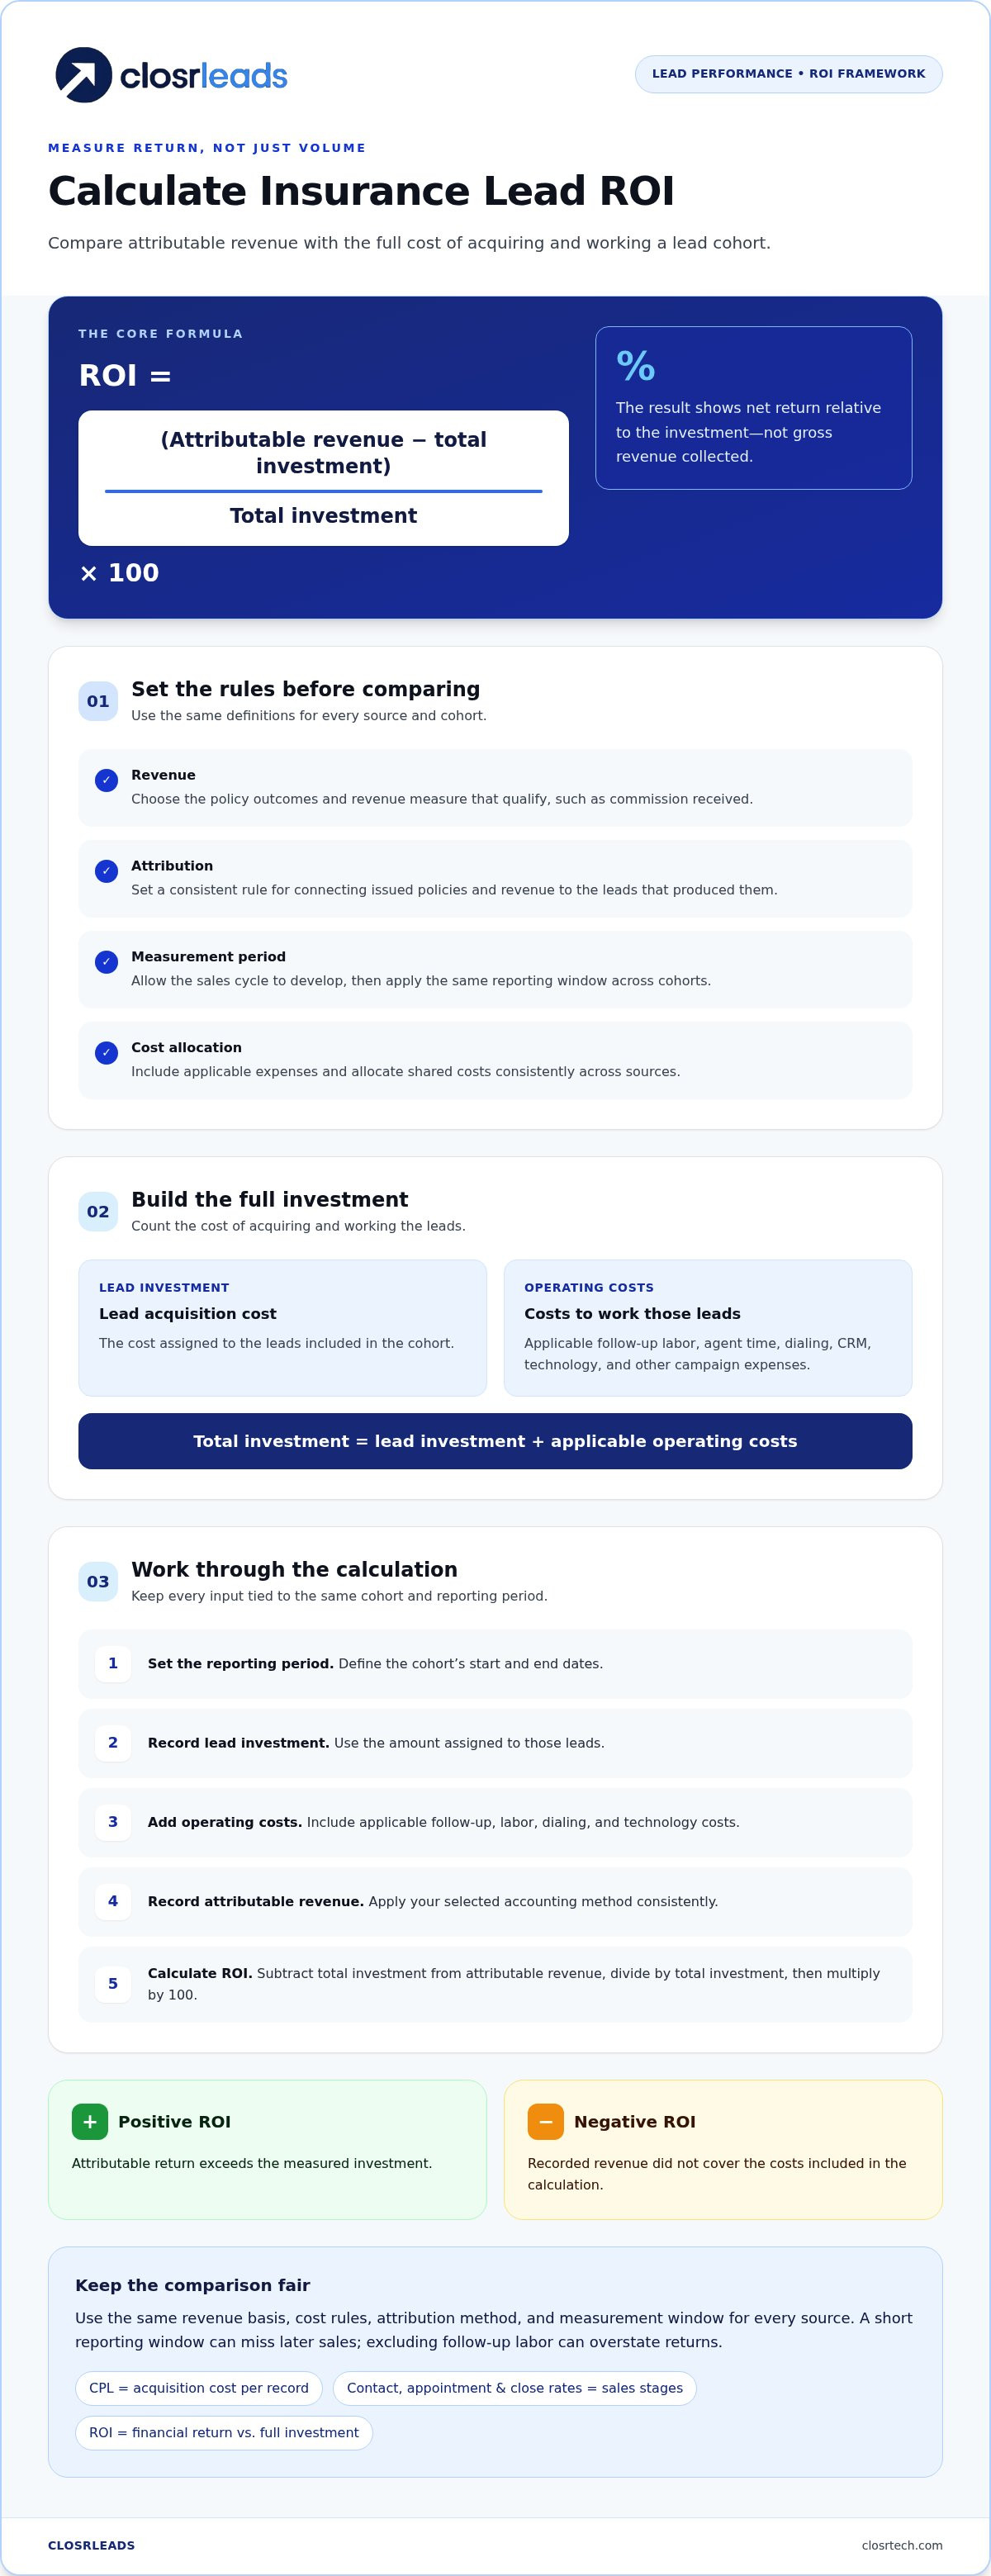
Use one formula, then apply its inputs consistently across every lead source and reporting period:
ROI = ((attributable revenue − total investment) ÷ total investment) × 100
Total investment is the cost of acquiring and working the leads. Attributable revenue is the revenue your accounting method assigns to the resulting business. The percentage shows net return relative to the investment, not gross revenue collected.
Positive ROI means attributable return exceeds measured investment. A negative result means the recorded revenue did not cover the costs included in the calculation. For a broader view of the insurance sector’s financial context, the NAIC publishes Insurance Industry Trends and Analysis.
Which costs and revenue belong in the calculation?
Build a complete cost figure for each cohort. Include lead acquisition and applicable campaign expenses, such as agent time spent calling and following up, dialing, CRM use, and other technology or operating costs. Allocate shared expenses consistently rather than counting them for only selected sources.
- Lead investment: The cost assigned to the leads in the cohort.
- Operating costs: Follow-up labor, dialing, CRM, and other applicable campaign expenses.
- Attributable revenue: Commission revenue or another defined measure linked to the leads.
Choose the revenue figure your agency uses, such as commission received, and apply that basis consistently. If cancellations, chargebacks, or persistency adjustments affect your accounting, reflect them according to your established method. Don’t mix projected revenue for one source with received revenue for another.
How to work through a sample ROI calculation
Start with placeholders, then substitute figures from your records. This symbolic example assumes all inputs belong to the same lead cohort and reporting period. It isn’t a typical result or a performance forecast. Choose a measurement period long enough to record your selected revenue measure consistently.
- Set the reporting period: Define the start and end dates for the cohort.
- Record lead investment: Call this amount L.
- Add operating costs: Call applicable follow-up, labor, dialing, and technology costs O. Total investment is L + O.
- Record attributable revenue: Call revenue credited to the cohort R, using your selected accounting method.
- Calculate: ROI = ((R − (L + O)) ÷ (L + O)) × 100.
Insert your own cohort values into ((R − (L + O)) ÷ (L + O)) × 100. Keep the attribution rule, expense categories, and reporting window the same when you repeat the calculation. That gives you a useful comparison instead of a result shaped by changing assumptions.
Consistent follow-up records help explain the cost side of the equation. A built-in dialer for lead follow-up can support activity tracking within your workflow.
How to Compare Insurance Lead Sources and Lead Types Fairly
A source comparison is useful only when the inputs are comparable. One lead group may look more profitable because it received faster follow-up, more agent attention, or more time to convert. Separate source performance from sales execution, then apply the same measurement rules across cohorts.
Build a comparison table with one row per cohort. Include fields that explain both the outcome and the process behind it:
- Source and campaign: Record where the lead came from and which campaign produced it.
- Vertical and lead age: Identify the insurance line and whether the record was real-time or aged.
- Verification: Note the verification method and relevant record details. For example, OTP-verified insurance leads provide a verification detail to track, not a promise of conversion.
- Contact and conversion: Track leads reached, appointments set, and policies attributed to the cohort using consistent definitions.
- Full cost and ROI: Include applicable acquisition, labor, dialing, CRM, and other campaign costs, then calculate ROI the same way for each row.
Compare lead cohorts without mixing unlike results
Group records by source, vertical, age, campaign, and acquisition period. Keep targeting, assignment, and follow-up rules consistent wherever practical. If one group gets more attempts or faster calls, record that difference instead of treating the outcome as a pure source effect. Compare mature cohorts with mature cohorts. Leads that have barely entered follow-up need more time before you can judge their results.
Separate agent availability from lead-source performance, too. Track when leads arrive, when the first attempt happens, and how many follow-up attempts are made. If response speed differs across groups, your comparison can show that difference instead of crediting or blaming the source for an execution gap.
When should you compare real-time and aged leads?
Real-time and aged leads differ in freshness and follow-up context. Neither format guarantees stronger profitability. Compare them within the same vertical when possible, using equivalent assignment, contact procedures, expense allocation, and reporting windows. Record contact and conversion outcomes separately for each age group so the ROI result has useful context.
For a vertical-specific comparison, use Final Expense leads as the example category, while keeping lead age visible in your data. Don’t compare one vertical’s results with another and attribute the difference to lead age alone. Product, audience, and sales process can all affect outcomes.
This structure makes how to calculate insurance lead ROI more useful in practice: you can trace a result to the source, cohort, costs, and follow-up conditions that produced it. A consistent comparison doesn’t just rank leads. It shows where to focus your next operational test.
How to Track Insurance Lead ROI and Improve Campaign Decisions
A useful ROI figure depends on a clear trail from lead receipt to recorded revenue. Set up that trail once, then use the same workflow for each campaign. Track not only which source produced a policy, but also how prospects moved through the funnel and what it took to reach them.
- Tag each lead: Record its source, vertical, campaign, lead age, and acquisition period when it enters your CRM.
- Log activity: Capture contact attempts, response timing, conversations, and appointments using consistent fields.
- Attribute outcomes: Connect applications, placed policies, and revenue to the original lead or cohort under your agency’s attribution rules.
- Calculate ROI: Apply the same cost and revenue definitions to each cohort.
- Review cohorts: Compare results after the relevant sales cycle has had time to mature, then document what changed and why.
Keep funnel stages separate. A contacted lead isn’t an appointment; an appointment isn’t an application; and an application isn’t necessarily a placed policy. Recording each stage shows where progress slows, while revenue tracking shows whether the final outcomes support the investment.
What should an insurance lead ROI dashboard include?
Make the dashboard easy to interpret. Include source and cohort tags, acquisition spend, follow-up activity, and attributable outcomes. Show contact, appointment, application, placed-policy, and revenue counts separately. Use consistent definitions and reporting periods across campaigns so differences reflect performance rather than changing data rules.
Segment by vertical as well as source. For example, mortgage protection leads should be identifiable as their own cohort, not blended into an agency-wide average. This makes it easier to see whether a change is tied to a particular campaign or line of business.
How do you decide whether to adjust or scale a source?
Don’t shift campaign allocation based on one strong sale, a small batch, or leads still early in follow-up. First review contact activity, stage-by-stage conversion, and full costs. A slowdown at the contact stage calls for a different investigation than applications that fail to become placed policies.
Before acting, write down your decision rule: which measure must change, which cohort qualifies for review, and what evidence would justify an adjustment. Then reassess after the next comparable cohort matures. This creates a repeatable feedback loop instead of a reaction to noise.
Consistent CRM records and follow-up activity make how to calculate insurance lead ROI a process your team can repeat and audit. Explore insurance leads and a built-in dialer as connected parts of your workflow.
How ClosrLeads Supports Measurable Insurance Lead ROI
Once your formula and reporting rules are set, lead handling becomes part of the measurement system. ClosrLeads provides real-time and aged insurance leads across Final Expense, Veteran, Trucker, Mortgage Protection, and IUL verticals. Treat each as a distinct cohort to track, not a guaranteed return. Your agency’s follow-up, costs, attribution method, and sales outcomes determine the ROI you record.
For clearer analysis, capture when a lead arrives, how it’s verified, what follow-up takes place, and which outcomes can be attributed to it. Those details help explain the numbers without turning a feature into a sales promise.
Which ClosrLeads features can support measurement?
Real-time delivery into your CRM can help establish a consistent receipt timestamp, making it easier to record the interval before the first follow-up attempt. That supports speed-to-lead tracking. The built-in dialer helps agents manage follow-up activity, while CRM records can capture contact attempts and later outcomes. Include applicable technology and labor costs in your ROI calculation.
Leads include OTP phone verification and TCPA consent records. Record and review these details within your process, but don’t treat them as proof of future contact, a policy sale, or compliance with an agent’s obligations. Consistent source details and activity records make it easier to trace a cohort from delivery through its sales stages. ClosrLeads also provides a replacement guarantee for invalid contacts.
How to take the next step with a measurable test
Define the test before starting a campaign. Choose a vertical and cohort, set a budget, establish how you’ll attribute policy revenue, and select a review window that gives the sales cycle time to mature. Record your baseline and use the same definitions for each funnel stage and expense category. A focused test is easier to interpret than changing multiple variables at once.
- Choose a cohort: Identify the vertical, lead age, and campaign you plan to evaluate.
- Set the measurement rules: Decide which expenses count, how outcomes will be attributed, and when you’ll review results.
- Track the full path: Record receipt, follow-up, contact, appointment, application, placed policy, and revenue where applicable.
- Apply the same formula: Compare the test with existing sources using consistent cost, attribution, and timing rules.
This is how to calculate insurance lead ROI in a way that supports a real decision: define the test, track what happens, then evaluate the mature cohort using your established method. Results vary with execution and accounting choices, so keep the framework stable when the lead source changes.
Ready to set up a measurable test? Explore ClosrLeads insurance leads and build your tracking plan around the vertical and cohort you want to evaluate.
Turn Your ROI Tracking Into Your Next Growth Move
Your next advantage comes from acting on what the numbers reveal. Choose one campaign decision to test, such as adjusting follow-up timing or refining how you assign leads. Set the measurement rules before making the change, then compare the next mature cohort with a baseline using the same definitions. That keeps the decision focused and makes it easier to see whether the change affected results.
Keep the process practical. Review the data regularly, note what changed, and record why you kept, adjusted, or paused an approach. Over time, those decisions build an agency-specific view of how to calculate insurance lead ROI and make measurement a repeatable operating habit rather than a one-time exercise.
Ready to put your plan into action? Explore ClosrLeads and build a measurable lead strategy. Start with a clear test, track the outcome, and let your results guide the next move.
Frequently Asked Questions
Is insurance lead ROI the same as return on ad spend?
No. Return on ad spend usually compares revenue attributed to advertising with advertising spend alone, while insurance lead ROI can include the broader cost of acquiring and working leads. When deciding how to calculate insurance lead ROI, state whether follow-up labor, dialing, CRM use, and other campaign expenses count. An ad campaign may look efficient based on media spend but less attractive after you include the work needed to convert its leads.
Can insurance lead ROI be negative at first and improve later?
Yes. Early in a cohort’s life, you may have paid for leads and follow-up before policies are placed or revenue is recorded. That makes an interim result incomplete, not necessarily a final verdict. Keep dated snapshots of the cohort’s performance, such as at an initial review and after the sales process has had time to develop. Label preliminary figures clearly, then update them as applications, placements, and revenue are recorded.
How many insurance leads do I need before calculating ROI?
There’s no universal lead count that guarantees a reliable conclusion. The right amount of data depends on how much contact, conversion, and revenue outcomes vary in your business. Record cohort size alongside ROI, and treat a result based on a small group as an early signal rather than a firm rule. As more comparable leads mature, check whether the pattern holds before making a major budget change.
What happens if a policy cancels after I counted its commission?
If you counted the commission before accounting for a later cancellation or chargeback, the initial result may overstate realized revenue. Follow your agency’s accounting method and decide how adjustments will be reflected. One practical approach is to label an early report as preliminary and update it when relevant adjustments are recorded. Apply the same treatment to every source so one cohort doesn’t retain revenue that comparable cohorts have had adjusted.
Should I include an agent’s time when calculating insurance lead ROI?
Include agent time when you want to compare the broader economics of campaigns, especially if one source takes more effort to work. Use a consistent internal method to value that time, such as logged hours multiplied by your chosen hourly cost. Keep the labor figure distinct from direct lead acquisition spend. You can report both acquisition-only ROI and fully loaded ROI, as long as each measure is labeled and applied consistently.
Can I calculate ROI when multiple agents work the same lead cohort?
Yes. Set a shared attribution rule before agents begin working the cohort, and record transfers, attempts, and outcomes against the same lead record. For example, your rule might assign resulting revenue to the original source even when another agent completes the sale. Avoid crediting the full revenue to multiple agents or sources. Document how shared activity is handled, then use that rule for every comparable cohort.
What is the difference between lead ROI and cost per sale?
Cost per sale measures the investment assigned to a campaign divided by the number of sales attributed to it. ROI compares attributable revenue with investment and expresses the net relationship as a percentage. Cost per sale tells you how much investment supported each placed policy, while ROI shows whether the revenue tied to those policies exceeded the measured costs. Use both measures when evaluating efficiency and return.